CPE Dashboard Tab
The Dashboard tab is the first screen you see when opening a CPE. It brings together, in one place, everything you need for a first diagnosis of the device.
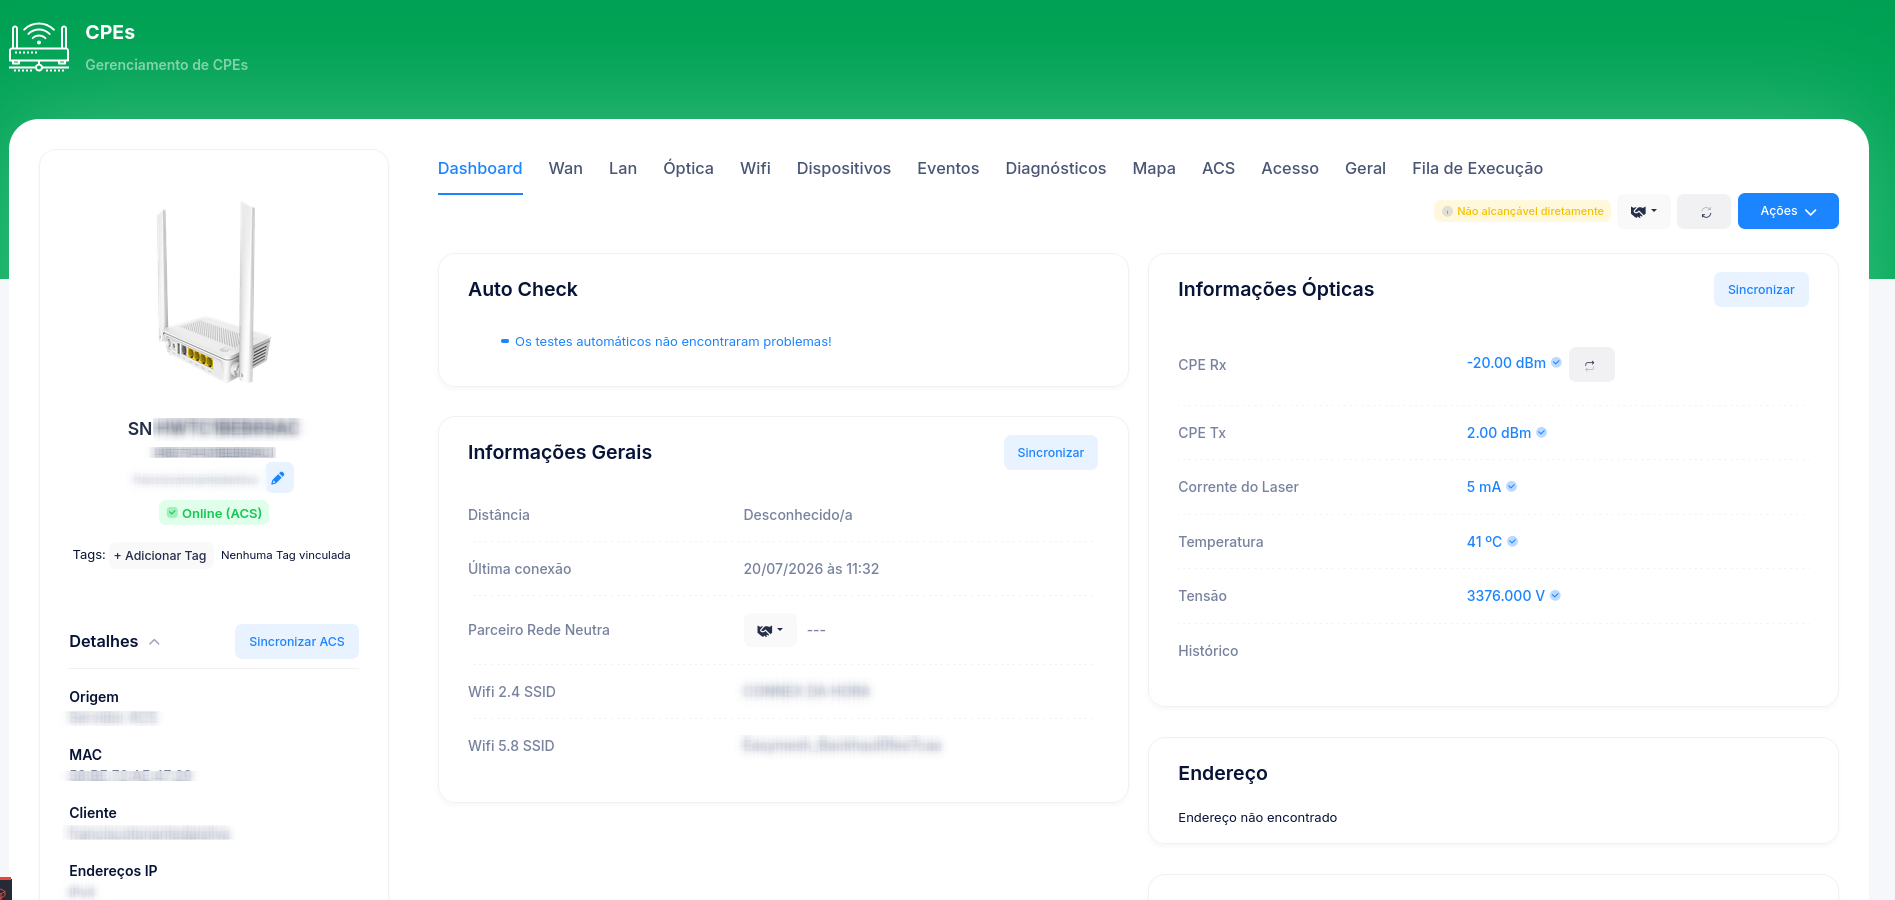
Side card (identification)
On the left are the model's photo, the serial (SN), the current status (e.g., Online, Awaiting activation), and a Details block with:
- Source OLT (link to the OLT).
- Frame / Slot / Port / OntID — the physical position.
- Sync OLT button, which updates this data by querying the OLT on the spot.
Information blocks
| Block | What it shows | Button |
|---|---|---|
| Auto Check | Automatic CPE health tests. When everything is fine, it shows "The automatic tests found no issues!". | — |
| General Information | Distance, neutral network partner, and other general data. | Sync |
| Optical Information | Optical power (RX/TX) of the device. Basis for signal diagnostics. | Sync |
| Address (via ERP) | Customer address, brought from the ERP. | Sync |
| Contacts (via ERP) | Customer contacts, brought from the ERP. | Sync |
| ERP Data | Contract/registration information coming from the ERP. | Sync |
The "Sync" buttons
Each block has its own Sync button, which fetches the updated data from the source (OLT or ERP) at that moment. Use it when you suspect the displayed information is outdated.
When a block appears empty
If the CPE is known only via the OLT (no ACS/TR-069), or is Awaiting activation, several blocks appear empty ("No information recorded"). This is expected — rich data is only available when there's a TR-069 session and/or ERP integration. See the explanation in Working with CPEs.
See also
- Optics Tab — to diagnose signal
- Diagnostics Tab — ping, traceroute, speed
- CPE Actions